Realtime manhole detection system
INTRODUCTION
Manholes and sewer wells in urban areas are used to conduct rainwater, drainage, power cables, telecommunication cables, and other things. They are usually covered with a metal-made cover to keep things from dropping into the well. However, if the cover is removed by someone or broken caused by some uncertain factors, it is dangerous to the moving cars and pedestrians. Therefore, efficient and cost-effective means and methods that can monitor potential disasters on the road are urgently in demand. Detecting and monitoring manhole and sewer well covers is greatly important to the transportation infrastructure management department; and it provides a promising and essential way to prevent potential disasters on the road.
An integral part of any drainage system is the access points into it when it comes to cleaning, clearing, and inspection. Metropolitan cities have adopted underground drainage system and the city’s municipal corporation must maintain its cleanliness. If the sewage maintenance is not proper, ground water gets contaminated causing infectious diseases. Blockages in drains during monsoon season, causes problems in the routine of the public. Hence, there should be a facility in the city’s corporation, which alerts the officials about blockages in sewers, their exact location and also if the manhole lid is open automatically. Underground drainage consists of sewage system, gas pipeline network, water pipelines, and manholes. Temperature sensors are deployed to avoid manhole explosions due to chemical release and electrical energy.
This paper represents the implementation and design function of and Underground Drainage and Manhole Monitoring System (UDMS) using IOT with separate transmitter and receiver models. It mainly acknowledges in the field of alerting the people about the gas explosion, increase in the water level and the opened lid. It uses IOT to make the drainage monitoring system in a highly automotive by using sensor for detecting and sending alerts through GSM and GPS module to the authorities, storing the data in the cloud and displaying the details in the web browser. This project overcomes the demerits by detecting drainage water blockage by installing water flow rate sensors at the intersection of nodes. When there is a blockage in a particular node, there is variation in the flow of drainage water which when cross the set value will display the alert in the managing station.
Also other demerits are solved by detecting temperature variations inside the manhole and alerting the same to the managing station through automatic message. Also, flow rate sensors are used to detect the over flow of the drainage water and alerting the same to the managing station through automatic message. So, the main focus of this project is to provide a system which monitors water level, atmospheric temperature, water flow and toxic gases. If drainage gets blocked and sewage water over flows, manhole lid opens, it is sensed by the sensors and this data is sent to the corresponding managing station via transmitter located in that area.
Maintenance of manholes manually is tedious and dangerous due to the poor environmental conditions inside. It is, therefore dangerous to go inside the manholes for inspection of its current state. To solve all the problems related to underground sanitation, a remote alarm system is necessary for transmitting data collected by the sensors set inside the manhole to the managing station. This project uses Wireless Sensor Networks (WSN) to implement this system. These nodes are composed of controller, memory, transceiver and battery to supply power.
CHAPTER 2
BACKGROUND STUDY
2.1 The design space of wireless sensor networks, Wireless Communications. [1]
In the recent past, wireless sensor networks have found their way into a wide variety of applications and systems with vastly varying requirements and characteristics. As a consequence, it is becoming increasingly difficult to discuss typical requirements regarding hardware issues and software support. This is particularly problematic in a multidisciplinary research area such as wireless sensor networks, where close collaboration between users, application domain experts, hardware designers, and software developers is needed to implement efficient systems. In this paper we discuss the consequences of this fact with regard to the design space of wireless sensor networks by considering its various dimensions. We justify our view by demonstrating that specific existing applications occupy different points in the design space.
2.2 Towards the Implementation of IOT for Environmental
Condition Monitoring in Homes. [2]
In this paper, we have reported an effective implementation for Internet of Things used for monitoring regular domestic conditions by means of low cost ubiquitous sensing system. The description about the integrated network architecture and the interconnecting mechanisms for reliable measurement of parameters by smart sensors and transmission of data via internet is being presented. The longitudinal learning system was able to provide self-control mechanism for better operations of the devices in monitoring stage. The framework of the monitoring system is based on combination of pervasive distributed sensing units, information system for data aggregation, reasoning and context awareness. Results are encouraging as the reliability of sensing information transmission through the proposed integrated network architecture is 97%. The prototype was tested to generate real time graphical information rather than a test bed scenario.
2.3 .Smart Real-Time Drainage Monitoring System Using
Internet of Things.[3]
Drainage system monitoring plays an important role to keep city clean. In fact, not all areas have drainage monitoring team. It leads to irregular monitoring of the drainage condition. The irregular monitoring leads to the blocking of the drainage that imply to the salutation which trigger flood. Manual monitoring is also incompetent. It requires a professionals but they can only monitor very finite and maintain low accuracy. Also sometimes due to lack of knowledge the worker may meets to an accident as they have no idea that how will be the conditions in those manhole. This paper represents the application and design function of a smart and real-time Drainage and Manhole Monitoring System with the help of Internet of Things. The manholes present in the drainage will have a module which is having microcontroller interfaced with gas sensor, level indicator, NRF. The system will monitor if the blockage is occurred in between two manholes and also it will sense the rise in amount of various gases which are harmful to the human beings, and also a system of monitoring the water level then it will trigger an alarm and will provide those information to the health departments from which the particular action will be taken. The system will able to monitor all these things in real-time scenario which will allow us to take proper actions of the particular problem in drainage system.
This paper is not efficient way of monitoring the drainage system because it does not make use of over flow sensor to detect the blockage in the drainage , for making efficient we make use of ultrasonic sensor.
2.4 Underground Drainage Monitoring System Using IOT.[4]
India has announced a project of making 100 smart cities. For making a smart city one needs to consider many parameters such as smart water, smart electricity, smart transportation etc. There will be a need of smart underground infrastructure which includes underground water pipelines, communication cables, gas pipelines, electric flow, etc. As most of the cities in India have adopted underground drainage system, it is very important that this system should work in a proper manner to keep the city clean, safe and healthy. If they fail to maintain the drainage system the pure water may get contaminated with drainage water and can spread infectious diseases. So different kind of work has been done to detect, maintain and manage these underground systems. Also, leaks and bursts are unavoidable aspects of water distribution system management and can account for significant water loss within a distribution network if left undetected for long period. This project represents the implementation and design functions for monitoring and managing underground drainage system with different approaches. It also gives a description of water wise system and detection method to detect leakage defects in sewer pipeline. Also, some part of condition rating model for underground Infrastructure Sustainable Water Mains and Intelligent system for underground pipeline assessment, rehabilitation and management are explained.
This paper is more complex for the implementation because they make use of GPS as well as GSM module , so to reduce the complexity of this project we are only using GSM module to increase the efficiency.
2.5 Automated Internet of Things for Underground Drainage and Manhole Monitoring System for Metropolitan Cities.[5]
The Internet of Things (IoT) consists of real life objects, communication devices attached to sensor networks in order to provide communication and automated actions between real world and information world. IoT came into existence because, without human interaction computers were able to access data from objects and devices, but it was aimed at, to overcome the limiting factors of human entered data, and to achieve cost, accuracy and generality factors. Sensor Network is a key enabler for IoT paradigm. This paper represents the implementation and design function of an Underground Drainage and Manhole Monitoring System (UDMS) for IoT applications.
The vital considerations of this design are low cost, low maintenance, fast deployment, and high number of sensors, long life-time and high quality of service. The proposed model provides a system of monitoring the water level and atmospheric temperature and pressure inside a manhole and to check whether a manhole lid is open. It also monitors underground installed electric power lines. In real time, UDMS can remotely monitor current states of the manholes.
This paper does not gives or determines the blockage of the manhole system so we decided to make use of this paper to determine the blockage of the manhole system.
2.6 IoT Equipment Structure with Reduced Risk of Damage on Attachable to Manhole Cover.[6]
In this paper, two monopole antenna designs with reduced risk of damage by collision are presented; they operate at 920 MHz for a low-power wide area network and can be attached to the bottom of the existing metal manhole covers. The first proposed antenna is a thin small top-loaded antenna surrounded by walls and floor, which serve as the antenna ground; the antenna is coupled to the cover by an electric field. The second proposed antenna is like a pendant, and two case of this antenna are illustrated: In the first case, the antenna straightly protrudes to the hole as a result of gravity and is not affected by external forces (normal state), while in the second case, the antenna is deformed by external forces (deformed state). The Received Signal Strength Indicators of antennas are much better than those of the solid rod dipole antenna housed in center space to avoid collisions.
In this paper, the two monopole antenna designs with reduced risk of collision damage are described. Their communication characteristics are better than those of the rod antenna set slantwise in the space surrounded by walls and floor on the manhole cover. The first design is an antenna surrounded by metal walls and floor to avoid damage. The second design is an antenna structure is straight with gravity and is not damaged even when deformed by external forces. For the second proposed antenna, another application example other than a manhole is demonstrated: application in a moving object such as a train; the antenna will continue to communicate and not break when deformed, even on collision with a flying object.
In this paper it increases the complexity because of the two antenna used for the implementation so it increases the size of the project ,we can maintain this by using in build antenna which will reduce the complexity of the project.
2.7 Edge Computing-based Intelligent Manhole Cover Management
System for Smart Cities.[7]
An intelligent manhole cover management system is one of the most important basic platforms in a smart city to prevent frequent manhole cover accidents. Manhole cover displacement, loss, and damage pose threats to personal safety, which is contrary to the aim of smart cities. This paper proposes an edge computing-based intelligent manhole cover management system (IMCS) for smart cities. A unique radio frequency identification tag with tilt and vibration sensors is used for each manhole cover, and a narrow-band internet of things is adopted for communication. Meanwhile, edge computing servers interact with corresponding management personnel through mobile devices based on the collected information. A demonstration application of the proposed IMCS in the Xiasha District of Hangzhou, China, showed its high efficiency. It efficiently reduced the average repair time, which could improve the security for both people and manhole covers.
In this paper they make use of RFID tags so that they can identify whether the manhole lid is open or not ,but they cannot identify any other danger. Here in our project we make use of different sensors so that we can identify other danger like poisonous gas emission, overflow ,blockage etc.
2.8 Automated Detection of Road Manhole and Sewer Well Covers From Mobile LiDAR Point Clouds.[8]
A novel object detection algorithm is developed for automatically detecting road manhole and sewer well covers from mobile light detection and ranging point clouds. This algorithm takes advantage of a marked point process of disks and rectangles to model the locations of manhole and sewer well covers and their geometric dimensions. A reversible jump Markov chain Monte Carlo algorithm is implemented for simulating the posterior distribution obtained using a Bayesian paradigm. The detection results obtained from the road surface point clouds acquired by a RIEGL VMX-450 system show that the manhole and sewer well covers can be detected automatically and accurately. The performance achieved using the proposed algorithm is much more accurate and effective than those of the other three existing algorithms.
As we came through this paper and researched we understood that it gives only the 3D pictorial view about the manhole whether manhole lid is open or close, so this is the disadvantage of this paper .So in our project we are using different sensors and maintaining the manhole by identifying and informing about manhole problem to the authorities so they can maintain manhole in a proper way. In our paper it not only shows the pictorial view but gives the information to the authorities and make use of the time to manage the manhole system. This helps us to maintain and inspect the area in a proper way in order to maintain a smarter cities. So implementing this can avoid the disadvantage of this paper and it also given us the proper information regarding this project .
2.9 Monitoring Smart City Applications using Raspberry PI
Based on IOT.[9]
The Smart city is the development goal to monitor the quality of resource in the city to improve good management and faster development of the city required necessity is to upgrade healthy and safe cities that delivering real time services and latest facility to implement the concept of smart city use IoT concept by which easy wireless communication is possible. The system consist of sensors, collect different types of data from sensors and transfer to the Raspberry Pi3 controller. The acquired output from the controller is sent to the control room through the E- mail and also display on the personal computer.
This paper explains the use of Raspberry PI model for monitoring the manhole system ,this will increase the complexity of the program and it is difficult to interface.
So changing from Raspberry PI to Arduino Uno can reduce the complexity of the project as well as it is easy to interface than that of Raspberry PI.
2.10 IOT based smart drainage worker safety system.[10]
The process of drainage monitoring and maintain plays a big role to keep the city neat and clean. This leads to an informal way of monitoring and cleaning the drainage manholes when it is blocked. The process of unblocking and cleaning process may lead to much human death because of the gas. Additionally some of the time because of the absence of information the specialist may meet to a mishap as they have no clue about the state of the gas level in the seepage. This paper helps to solve the problem by a smart device with the help of the IoT. The MQ4 sensor and the single board computer raspberry pi 3 helps to detect the gas level with the LED display. This system will help to identify the gas level inside the drainage manholes so that the worker can get some idea of entering into the manholes. It very helps workers and safety to them before getting down into the manholes and it will sense the level of the gas inside. Savvy framework will be checking if the blockage has happened in the middle of two sewer vents and furthermore it will detect different gas level which is hurtful to individuals, and furthermore a framework observing the water level then it will trigger an alert and it will offer data to the crisis division and wellbeing offices which will make specific move at time. The framework will ready to screen every one of these things in the continuous situation which will enable us to make a legitimate move of the specific issue in seepage frameworks. This paper focus mainly on the sewers health but paper explained in a good manner but it should also focus on the people around the manhole system.
CHAPTER 3
PROPOSED SYSTEM
3.1 THE SYSTEM PROPOSES:
Detect the location
The system governing the over flow, blockage, detection of dangerous gases and also identifies the manhole lid is open or close .
Uses different sensors to detect the variations in the manhole.
Get the prior alerts of blockages and locate them using IOT. Trace location and sends SMS through WIFI module.
3.2 OBJECTIVES
Cleaner cities and intelligent management of drainage in the city.
Detection of drainage water level and blockages in the drainage.
Checking water flow rate continuously, as well as sending automatic mail, display on the monitor if the water level is outside of an expected normal range.
The main objective is to obtain an effective low-cost and flexible solution for condition monitoring and infrastructure management in the city.
Sensing the temperature and leakage of gas and updating it in real time through IoT.
3.3 BLOCK DIAGRAM
The functional block diagram describes the monitoring of manhole in underground drainage system. Any blockages, rise in temperature, explosion due to toxic gases, overflow, manhole lid left open is detected by the sensors. The signals from the sensors are fed to the controller, which is programmed to generate alerts.
In this we use sensors to detect blockage, floods, and gases. The sensors will identify the clogging inside the drainage system and will give information about the location and further actions will be taken care by the municipal.
This system consists of:-
A. Sensor network
B. Transmission station


![]()
![]()
![]()
![]()
![]()
![]()
![]()
![]()
![]()
![]()
![]()


![]()
![]()
![]()
![]()
![]()
![]()
![]()
![]()
![]()
![]()

![]()
![]()
![]()
![]()
![]()
 Fig 3.4 Block Diagram
- Sensor Network
Sensor Network consists of:
WIFI Module-NodeMCU ESP8266: Here WiFi module is used to sent message to the authority.
Tilt sensor –SW520D: Tilt sensor is used to measure the opening and closing of the manhole system.
Temperature sensor-DHT11: Temperature sensor is a device used to measure the hotness or coldness of an object. We are using this sensor to measure both temperature and humidity..
Ultrasonic sensor-HC-SR04: Ultrasonic sensor has greater accuracy in measuring the thickness and distance , so we use this sensor to measure the overflow of water.
Gas Sensor-MQ2: MQ2 Gas sensor detects combustible gasses and smoke.
- Transmission Station
This station helps to send signals from sensors. This station consists of Arduino Uno which are the microcontrollers that are interfaced. The signals received by the Arduino from the sensors is converted from analog signals to digital signals with the help of ADC located in the Arduino board and further is processed and sent to the WiFi module which takes this as input data. An alert is displayed in the managing station and an email is sent to the respective authority
. CHAPTER 4
HARDWARE COMPONENTS
4.1 ARDUINO UNO
The Arduino Uno 328P is a microcontroller board based on the ATMEGA8U2 (datasheet). It has 14 digital input/output pins (of which 14 can be used as PWM outputs), 6 analog inputs, a 16 MHz crystal oscillator, a USB connection, a power jack, an ICSP header, and a reset button. It contains everything needed to support the microcontroller; simply connect it to a computer with a USB cable or power it with an AC to-DC adapter or battery to get started. The Uno is compatible with most shields designed for the Arduino Duemilanove or Diecimila.
.
. 
Fig 4.1 Arduino Uno
Power
The Arduino Uno can be powered via the USB connection or with an external power supply. The power source is selected automatically. External (non-USB) power can come either from an AC-to-DC adapter (wall-wart) or battery. The adapter can be connected by plugging a 2.1mm centre-positive plug into the board's power jack. Leads from a battery can be inserted in the Gnd and Vin pin headers of the POWER connector. The board can operate on an external supply of 6 to 20 volts. If supplied with less than 7V, however, the 5V pin may supply less than five volts and the board may be unstable. If using more than 12V, the voltage regulator may overheat and damage the board. The recommended range is 7 to 12 volts. The Uno differs from all preceding boards in that it does not use the FTDI USB-to serial driver chip.

Fig 4.3 Pinout of Arduino Uno
The power pins are as follows:
VIN: The input voltage to the Arduino board when it's using an external power source (as opposed to 5 volts from the USB connection or other regulated power source). You can supply voltage through this pin, or, if supplying voltage via the power jack, access it through this pin.
5V: The regulated power supply used to power the microcontroller and other components on the board. This can come either from VIN via an on-board regulator, or be supplied by USB or another regulated 5V supply
3V3: A 3.3-volt supply generated by the on-board regulator. Maximum current draw is 50 mA.
GND: Ground pins.
Memory
The ATMEGA328P has 32 KB of flash memory for storing code, 2 KB of SRAM and 1 KB of EEPROM.
Input and Output
Each of the 14 digital pins on the Uno can be used as an input or output, using pinMode() , digitalWrite(), and digitalRead() functions. They operate at 5 volts. Each pin can provide or receive a maximum of 20 mA and has an internal pull-up resistor (disconnected by default) of 20-50 kΩ. In addition, some pins have specialized functions:
Serial: Pins 0 (RX) and 1 (TX). Used to receive (RX) and transmit (TX) TTL serial data. These pins are connected to the corresponding pins of the ATmega8U2 USB-to-TTL serial chip.
External Interrupts: pins 2 and 3. These pins can be configured to trigger an interrupt on a low value, a rising or falling edge, or a change in value.
PWM: 3, 5, 6, 9, 10, and 11. Can provide 8-bit PWM output with the analogWrite() function.
SPI: 10 (SS), 11 (MOSI), 12 (MISO), 13 (SCK). These pins support SPI communication using the SPI library.
LED: 13. There is a built-in LED connected to digital pin 13. When the pin is HIGH value, the LED is on, when the pin is LOW, it's off.
I2C: A4 or SDA pin and A5 or SCL pin. Support TWI communication using the Wire library.
The Uno has 6 analog inputs, each of which provide 10 bits of resolution (i.e. 1024 different values). By default, they measure from ground to 5 volts, though is it possible to change the upper end of their range using the AREF pin and analog Reference function. There are a couple of other pins on the board:
AREF: Reference voltage for the analog inputs. Used with analog Reference
Reset: Bring this line LOW to reset the microcontroller. Typically used to add a reset button to shields which block the one on the board.
4.2 ULTRASONIC SENSOR: HC-SR04
HC-SR04 Ultrasonic sensor is a 4 pin module ,whose pin names are VCC, Trigger, Echo and Ground respectively. This sensor is a very popular sensor used in many application where measuring distance or sensing objects are required .The module has two eye like projections in front of which forms the Ultrasonic transmitter and receiver. The Ultrasonic transmitter transmits an ultrasonic waves ,this wave travels in air and when it gets objected by any material it gets reflected back towards the sensor this reflected wave is observed by the ultrasonic receiver.

Fig 4.3 Ultrasonic sensor
The PIN Outs :
VCC – The VCC pin powers the sensors ,typically with +5V.
Trigger – Trigger pin is an input pin. This pin has to keep high for 10us to initialize measurement by sending US waves.
Echo – Echo pin is an output pin .This pin goes high for a period of time which will be equal to the time taken for the US wave to return back to the sensor.
Ground- This pin is connected to the ground of the system.
Features
Operating Voltage :+5V
Measuring Distance : 2cm to 450cm.
Accuracy :3mm
Measuring angle covered: <15 degree.
Operating frequency: 40Hz.
4.3 GAS SENSOR : MQ-2
The MQ-2 Gas Sensor can detect or measure gasses like LPG, Alcohol, Propane, Hydrogen, CO and even Methane. The module version of this sensor comes with a Digital Pin which makes this sensor to operate even without a microcontroller and that comes in handy when you are only trying to detect one particular gas. When it comes to measuring the gas in ppm the analog pin has to be used, the analog pin also TTL driven and works on 5V and hence can be used with most common microcontrollers.

Fig 4.4 MQ-2 Gas Sensor
The PIN Outs :
VCC – This pin powers the module, typically the operating voltage is +5V.
Ground – Used to connect the module to system ground.
Digital Out – You can use this sensor to get digital output pins, by setting a threshold value using the potentiometer.
Analog Out – This pin outputs 0-5V analog voltage based on the intensity of the gas.
Features :
Operating Voltage is +5V.
Can use to detect or measure LPG, Alcohol, Propane, Hydrogen, CO and even Methane.
Analog Output voltage :0V to 5V
Digital Output voltage : 0V to 5V (TTL logic)
Preheat duration 20 seconds.
Can be used as Digital or Analog sensor.
The sensitivity of the Digital pin can be varied using the potentiometer.
4.4 TILT SENSOR : SW-520D
Tilt Sensor is a device used for knowing the planar movements. Although they are available in various types their basic function remains the same. Their basic function is to detect the plain shift from horizontal to vertical and sent of a signal when it happens.
SW-520D is used when the cost of system cannot be high. It is one of the cheapest sensor in the market. It is easily available to replace in case of fault.
It is easy to install in the system .
With very long life this module can be used permanently installment .Also it does not require any additional components to install in a system.

Fig 4.5 SW-520D Tilt Sensor
The PIN Outs :
GND : Connected to GROUND.
VCC : Connected to +5V.
DO : Output of Tilt Sensor.
Features:
Supply voltage : 3.3V to 5V.
Output can directly connected to controller.
TTL level output.
Maximum output current :15mA.
Can work on low voltage.
Maximum operating temperature : 0 to 80 degree Celsius.
Easy interface .
Long life.
4.5 TEMPERATURE SENSOR : DHT11
The DHT11 is a commonly used temperature and humidity sensor. The sensor comes with a dedicated NTC to measure temperature and an 8-bit microcontroller to output the values of temperature and humidity as serial data. The sensor is also factory calibrated and hence easy to interface with other microcontrollers. The sensor can measure temperature from 0 to 50 degree Celsius and humidity from 20% to 90% .

Fig 4.6 DHT11 Temperature Sensor.
The PIN Outs :
VCC : Power supply 3.5V to 5.5V
Data : Output both temperature and humidity through serial data.
Ground : Connected to the ground of the circuit.
Features :
Operating voltage : 3.5V to 5.5V
Operating current : 0.3mA (measuring) 60uA (standby).
Output : Serial Data.
Temperature range : 0 to 50 degree Celsius.
Humidity range : 20% to 90%
Resolution : Temperature and Humidity both are of 16 bit.
4.6 WIFI MODULE : NodeMCU –ESP8266
NodeMCU is an open-source Lua based firmware and development board specially targeted for IoT based application. It includes firmware that runs on the ESP8266 WiFi SoC from Espressif system ,and hardware which is based on the ESP-12E module. ESP8266 chip having Tensilica Xtensa 32-bits LX106 RISC microprocessor. This microprocessor supports RTOS and operates at 80MHz to 160MHz adjustable clock frequency. NodeMCU has 128 KB RAM and 4MB of flash memory to store data and programs. Its high processing power with in-built WiFi / Bluetooth and sleep operating features make it ideal for IoT projects. NodeMCU can be powered using Micro USB jack and VIN pin. It supports UART, SPI, and 12C interface.

Fig 4.7 NodeMCU-ESP8266

Fig 4.8 NodeMCU Pin Out
Power :
Micro-USB : NodeMCU can be powered through the USB port.
3.3V : Regulated 3.3V can be supplied to this pin to power the board.
GND : Ground pins.
VIN : External power supply.
Control Pins :
EN , RST –The pin and the button reset the microcontroller.
Analog Pin :
A0 – Used to measure analog voltage in the range of 0-3.3V.
GPIO pins :
GPIO1 to GPIO16 –NodeMCU has 16 general purpose input- output pins on its board.
SPI pins :
SD1, CMD, SD0,CLK – NodeMCU has four pins available for SPI .
UART pins :
TXD0, RXD0,TXD2,RXD2 – NodeMCU has two URAT interfaces, UART0 ( RXD0 & TXD0 ) and UART1 ( RXD1 & TXD1) UART 1 is used to upload the firmware/program.
12C pins :
NodeMCU has 12C functionality support but due to the internal functionality of these pins, you have to find which pin is 12C.
Features :
Microcontroller :Tensilica 32-bit RISC CPU Xtensa LX106
Operating voltage : 3.3V
Input voltage : 7-12V
Digital I/O Pins ( DIO ) :16
Analog Input Pins (ADC ) : 1
UARTs : 1
SPIs :1
12Cs : 1
Flash Memory : 4MB
SRAM : 64 KB
Clock Speed : 80MHz
USB- TTL based on CP2102 is included onboard, Enabling plug n play.
PCB Antenna.
Small sized module to fit smartly inside your IoT projects.
CHAPTER 5
HARDWARE IMPLEMENTATION
This sections mainly deals with the device operation and hardware implementation of the system. Here we are considering a transmitter section which includes a data collection and a receiver section to display that collected data. The preferred platform for our project is Arduino that will work on the atmega328.
5.1 SYSTEM OPERATION
The system consist of mainly two section .They are Sensor network and Transmission network. The sensor network consist of 4 sensors like Ultrasonic sensor, Gas sensor, Tilt sensor and Temperature sensor. These sensor senses and if there is any change in the set threshold value the sensors will transfer the message to the next network that is Transmission network . In transmission network there consist of Arduino Uno which is the microcontrollers that is interfaced. The signals received by the Arduino from the sensors is converted from analog signals to digital signals with the help of ADC located in the Arduino board and further is processed and sent to the WiFi module , which takes this as input data. An alert is displayed in the managing station and an email is sent to the respective authority.
5.2 HC-SR04 IMPLEMENTATION
When a pulse of at least 10 microseconds in duration is applied to the Trigger pin. In response to that of sensor transmits a sonic burst of 8 pulses at 40KHz. This 8 pulses pattern makes the ultrasonic signature from the device unique , allowing the receiver to differentiate the transmitted pattern from the ambient ultrasonic noise. The 8 ultrasonic pulses travel through the air away from the transmitter. Mean while the Echo pin goes HIGH to start forming the beginning of the echo-back signal. In case, if those pulses are not reflected back then Echo signal will timeout after 38ms and return LOW.

Fig 5.1 HC-SR04 Pinout

Fig 5.2 HC-SR04 Interfaced with Arduino Uno
The VCC pin of the HC-SR04 sensor is connected to the 5V of the Arduino.
The GND pin is connected to the Ground pin of Arduino.
The Trigger and Echo pin of HC-SR04 is connected to Digital pin ( D3 & D2) of the Arduino Uno.
5.3 DHT11 IMPLEMENTATION
Inside DHT11, there is a humidity sensing component along with a Thermistor. Humidity sensing component has two electrodes with moisture holding substrate sandwiched between them. The ions are released by the substrate as water vapor is absorbed by it, which in turn increases the conductivity between the electrodes.
The change in resistance between the two electrodes is proportional to the relative humidity. Higher relative humidity decreases the resistance between the electrodes, while lower relative humidity increases the resistance between the electrodes.
DHT11 also contains a NTC/Thermistor to measure temperature. A thermistor is a thermal resistor whose resistance changes drastically with temperature. NTC means Negative Temperature Coefficient, which means that the resistance decreases with increase of the temperature. DHT11 can measure temperature from 0 to 50 degree Celsius and humidity from 20 to 80% with 5% accuracy.
Operating voltage : 3.5V to 5.5V
Operating current : 0.3mA (measuring) 60uA (standby).
Output : Serial Data.
.

Fig 5.3 DHT11 pin outs

Fig 5.4 DHT11 interfaced with Arduino Uno
Connect the VCC pin to +5V of Arduino Uno.
Connect the GND pin to the GROUND of Arduino uno.
Finally connect the Output pin to the Digital pin #8 of Arduino Uno.
5.4 MQ2 IMPLEMENTATION
MQ2 is one of the commonly used gas sensor in MQ sensor series. It is a Metal Oxide Semiconductor (MOS) type Gas Sensor also known as Chemiresistors as the detection is based upon change of resistance of the sensing material when the Gas comes in contact with the material. The sensor is actually enclosed in two layers of fine stainless steel mesh called Anti-explosion network. It ensures that the heater element inside the sensor will cause an explosion, as we are sensing the flammable gases.
This mesh is bound to rest of the body via copper plated clamping ring. The star shaped structure is formed by the sensing element and six connecting legs that extend beyond the Bakelite base. Out of two leads (H) are responsible for heating the sensing element and are connected through Nickel-Chromium coil, well known as conductive alloy. The remaining leads (A & B) are for output signals are connected using Platinum Wires. The tubular sensing element is made up of Aluminum Oxide based Ceramic and has a coating of Tin Dioxide. The Tin Dioxide is the most important material being sensitive towards the combustible gases.
When tin dioxide is heated in the air at high temperature, oxygen is absorbed on the surface. In clean air donor electrons in tin dioxide are attracted towards oxygen which is absorbed on the surface of the sensing material. This prevents electric current flow. In the presence of reducing gases the surface density of absorbed oxygen decreases as it reacts with the reducing gases. Electrons are then released into the tin dioxide, allowing current to flow freely through the sensors.

Fig 5.5 MQ2 pin outs

Fig 5.6 MQ2 interfaced with Arduino Uno
Connect VCC pin to the 5V pin on the Arduino.
Connect GND pin to the Ground pin on the Arduino.
Connect D0 output pin on the module to Digital pin #8 on the Arduino.
And A0 output pin on the module to Analog pin #0 on the Arduino.
5.5 SW-520D IMPLEMENTATION
A SW-520D Tilt Sensor is an electronic device that detects the orientation of an object and gives its output HIGH or LOW accordingly. It has a metallic ball inside it which moves and makes the circuit. The sensor’s sensitivity is at 10 degrees tilt. This module has two output pins for each path. When tilt angle is more than 10 degree, the output is low. When the tilt sensor is oriented so that that end is downwards, the mass rolls onto the poles and shorts them, acting as a switch stroke.

Fig 5.7 SW-520D pin outs.

Fig 5.8 SW-520D interfaced with Arduino Uno.
Connect the VCC to +5V of the Arduino.
Connect the GND to the GND of the Arduino.
Connect Digital output (DO) of the module to digital pin #2 (D2).
5.6 NodeMCU-ESP8266 IMPLEMENTATION
I2C (Inter-Integrated Circuit) is a serial bus interface connection protocol. It is also called as TWI (Two-wire interface) since it uses only two wires for communication. Those two wires are SDA (Serial Data) and SCL (serial clock). I2C is an acknowledgment – based communication protocol that is transmitter checks for an acknowledgement from the receiver after transmitting data to know whether data is received by the receiver successfully. I2C works in two modes; Master Mode and Slave Mode. SDA wire is used for data exchange between master and slave devices. SCL is used for synchronous clock in between master and slave devices. The master device initiates communication with a slave device address to initiate a conversation with a slave device. The slave device responds to the master device when it addressed by a master device. NodeMCU has I2C functionality support on its GPIO pins. Due to internal functionality on ESP-12E, we cannot use all its GPIOs for I2C functionality.

Fig 5.9 NodeMCU-ESP8266 interfaced with Arduino.
5.7 INTERFACING DIAGRAM

Fig 5.10 Interfacing Diagram.
CHAPTER 6
SOFTWARE AND STIMULATION
The system works on a logic defined by the program, set in the Arduino used here, Arduino Uno. So this section describes the algorithm and flowchart related to the programming. Programming was done using Arduino Uno 1.8.11.
6.1 ALGORITHM
Step 1: Start
Step 2: Powering up the Hardware.
Step 3: Sensors are ready to sense.
Step 4: Arduino continuously takes the value from the sensors.
Step 5: If Arduino pin is HIGH it enables NodeMCU
Step 6: Then enabling BLYNK server.
Step 7: Sending Data to Managing Station.
Step 8: Stop
6.2 FLOWCHART
![]()
![]()
![]()
![]()
![]()
![]()
![]()
![]()
![]()
![]()
![]()


![]()
![]()
![]()
![]()


![]()

![]() YES
YES
![]()
![]()

NO
![]()
![]()


![]()
Fig 6.1 Flow Chart
6.3 EasyEDA
For the simulation purpose the software used is EasyEDA. EasyEDA is an online-based PCB design tool. It allows to design schematics and PCB without having to download and install any software on computer. We get to work on designs online using a web browser. EasyEDA is online-based. This feature gives it several advantages over the traditional PC based design tools. For instance, the software is usually hosted on servers that are directly managed by the EasyEDA Company, so any software updates are done automatically. This ensures that we have access to the latest features all the time.
Access to our projects is not limited to one computer only. Our projects will be stored in the cloud, so we can access them from any device that has a web browser. This way we can work on your projects from any place, thus increasing our efficiency and reducing the time it takes to finish designing our PCB. Most of the things, such as libraries, projects, custom-made parts, packages and shared files are accessible via a simple drop down menu at the top left side of the software interface. This makes it easy for us to navigate through the software regardless of whether we are beginner or pro. Therefore, we won’t waste a lot of time trying to figure out where something is or scouring through tutorials to find a simple feature.
In addition to having a simple interface, EasyEDA also provides information on the different tools and features. This information is provided through tooltips, when we hover the mouse pointer over a specific icon, and also in an elaborate tutorial page that explains every feature in detail. Therefore, we can learn the ropes in the shortest time possible and dedicate more time to building our project. Testing is a very important step in PCB manufacture. However, it is not always the easiest thing to do. In most cases we have to physically assemble your circuit on a breadboard or perf board before doing the actual tests. The process takes a while and will in most cases delay the design and manufacturing process.
To solve this, EasyEDA is designed with a circuit simulation tool that allows you to see our circuit in action before developing it into a board. All we need to do is add a probe to the circuit and run the simulation. This will save us a lot of time and makes the design process easier.
6.4 ARDUINO IDE 1.8.11.
The Arduino Integrated Development Environment (IDE), also known as the Arduino Development Environment, is a program designed to make it easier to write software for this open source platform. IDEs are commonly used by programmers to speed up the process of programming. Common IDE features include automatic line numbering, syntax highlighting, and integrated compiling. While it is technically possible to write software using only a simple text editor, the process is much easier when writing code in an IDE. Many programming languages have their own IDEs, and several general purpose IDEs have been developed. These general purpose IDEs can be used with a variety of supported programming languages.
The software platform of Arduino Microcontroller used by the system is Arduino IDE version 1.8.11. It is open source software which supports easy code writing and uploading the program on the board. It runs on Windows, Mac OS X and Linux. The Arduino IDE is a cross-platform Java application that serves as a code editor and compiler and is also capable of transferring firmware serially to the board. The development environment is based on processing, an IDE designed to introduce programming to artists unfamiliar with software development. The programming language is derived from wiring, a C-like language that provides similar functionality for a more tightly restricted board design, whose IDE is also based on processing. Arduino programs can be divided in three main parts: structure, values (variables and constants), and functions. So structure, variables and constants are similar to c language but there are different functions to access the Arduino hardware.
Each software program written using the Arduino platform is called a sketch. Sketches do not include a main () function but instead use functions setup () and loop () working in conjunction to perform similar functionality. The setup () function will run only once at the beginning of execution. It is used to initialize serial port settings and configure input/output ports. Any local variables defined within the setup () cannot be used in loop (). The loop () function will execute repeatedly until the Arduino is reset. The Arduino platform provides its own IDE to develop software, upload programs, and communicate with Arduino hardware. The development environment contains a text editor for writing code, a console for error messages, and a toolbar. The Serial monitor records all activity over the serial port and displays it onscreen. This tool is particularly useful for displaying the sensed values of the blink sensor.

Fig 6.2 Arduino IDE Working Window
6.5 BLYNK APPLICATION
Blynk was designed for the internet of things. It can control hardware remotely, it can display sensor data, and it can store data, visualize it and do many other cool things.
There are three major components in the platform:
Blynk app - allows to you create amazing interfaces for your projects using various widgets we provide.
Blynk server - responsible for all the communications between the smartphone and hardware. You can use our Blynk cloud or run your private Blynk server locally. Its open-source, could easily handle thousands of devices and can even be launched on a raspberry pi.
Blynk libraries - for all the popular hardware platforms - enable communication with the server and process all the incoming and out coming commands.
Features of Blynk Application:
Similar API & UI for all supported hardware & devices
Connection to the cloud using:
- Wi-Fi
- Bluetooth and BLE
- Ethernet
- USB (Serial)
- GSM
Set of easy-to-use Widgets
Direct pin manipulation with no code writing
Easy to integrate and add new functionality using virtual pins
History data monitoring via Super Chart widget
Device-to-Device communication using Bridge Widget
Sending emails, tweets, push notifications, etc.


Fig 6.3 BLYNK Application Window
CHAPTER 7
ADVANTAGES AND LIMITATIONS
The system that is proposed here will possess some of the advantages as well as disadvantages.
7.1 ADVANTAGES:
Easy to operate.
Cost effective.
This enables the person in-charge to take the necessary actions before things get more worse.
This reduces the unnecessary trips on the manholes and can only be conducted as and when required.
Real time update on the internet helps in maintaining the regularity in drainage check thus avoid the hazards.
7.2 LIMITATIONS:
Unauthorized interference create delay in data reception.
Sensing above tolerance value creates glitches.
We cannot send the notification through SMS alert because we have not added SMS module to our project.
CHAPTER 8
RESULT AND DISCUSSION
In this chapter the results of the study are presented and discussed. They are:
This system detects the blockages and overflow in the manhole.
With the help of sensors temperature, humidity and gas leakage can be identified.
The system also informs whether the manhole lid is open or closed by using the Tilt sensor.
When a particular sensor reaches the respective threshold level, then that respective value of the sensor will be sent to the microcontroller.
Microcontroller updates the live values of all the sensors using IoT. If any problem arises in the manhole, sensor senses it and sends that information to the microcontroller.
Furthermore, the microcontroller sends the signal and the exact location of the manhole through IoT to the managing station.
Then, an automatic mail is sent by WIFI. This alerts the person-in-charge to take the required actions regarding the problem occurring inside the manhole.


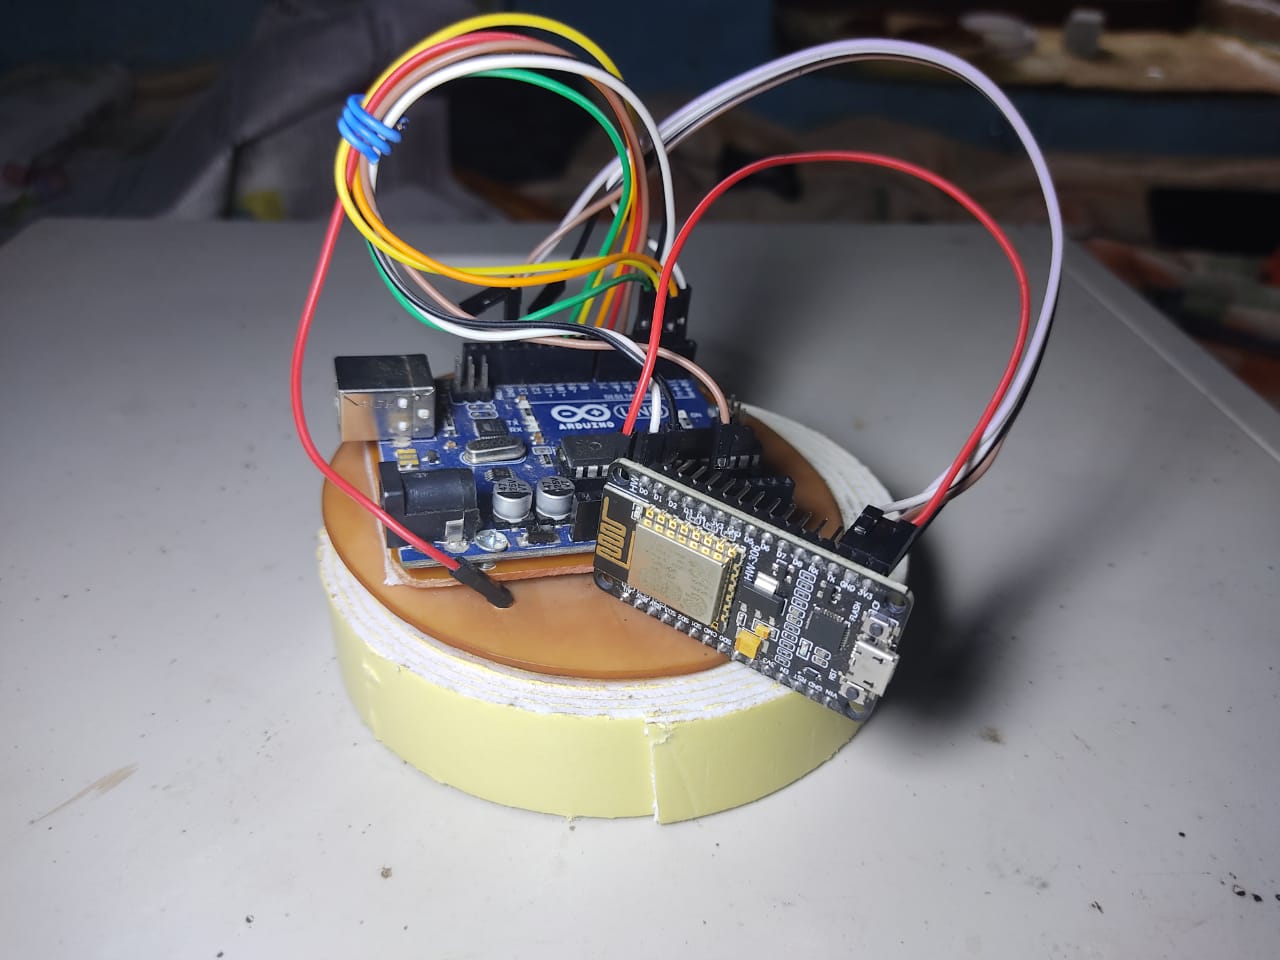
Fig 8.1 Proposed System Model

Fig 8.2 Observation of Ultrasonic Sensor

Fig 8.2 Observation of Temperature Sensor and Gas Sensor

Fig 8.3 Observation of Tilt Sensor
CHAPTER 9
CONCLUSION & FUTURE SCOPE
Sensor unit automatically senses and updates the live values of the physical parameters like temperature, humidity, water level and flow rate, blockages, and manhole cap is open or closed through IoT. This makes the system smart and automated. The deployment of Wireless Sensor Networks (WSN), helps in the implementation of the Smart cities in a developing countries. This WSN can also be useful in designing of environmental monitoring systems, which helps in monitoring of volcanic activities, flood detectors and other system. By a small modification in the implementation, this project can be used in agriculture fields or other environmental fields to monitor and control the systems.
In future, Smart cities infrastructure could be modified for intelligent communication and management of traffic signals, street lights, transit applications, active lanes, and so on. With the integration of smart devices in a city infrastructure can makes life in a city a lot easier. Also further by using PLC controller and SCADA systems, drainage water can be controlled, monitored and also this water can be used to irrigate plants, clean toilets, etc. This PLC and SCADA systems can be used as a treatment system for drainage water. Primarily, PLC controls the process of sewage treatment plant and SCADA is a remote terminal unit, which monitors and controls the entire area.
REFERENCES
[1] Prof Muragesh SK, Santhosha Rao, “Automated Internet of Things For Underground Drainage and Manhole Monitoring Systems For Metropolitan Cities.” International Journal of Information & Computation Technology, ISSN 0974-2239 Vol. 4, 2014.
[2] Dhanalakshmi.G, Akhil.S, Francisca Little Flower.M, Haribalambika.R, “Explosion detection and drainage monitoring system by Automation System” International Journal of Innovative research in computer and communication engineering, vol. 6, issue 2, February 2018.6
[3] Gaurang Sonawane, Chetan Mahajan, Anuja Nikale, Yogita dalvi, “Smart Real-Time Drainage Monitoring System USing IoT” May 2018, IRE Journals, Vol. 1 issue 11, ISSN: 2456-8880.
[4] Lazarescu, M.T., "Design of a WSN Platform for Long-Term Environmental Monitoring for IoT Applications," Emerging and Selected Topics in Circuits And Systems, IEEE Journal on, vol.3, no.1, pp.45, 54, March 2013.
[5] G.Gowtham, K.Hari Haran, G.Keerthee Rajan, A.Sweeto Jeison, “Sewage level maintenance using IoT” International Journal of Mechanical Engineering and Technical, vol. 9, Issue 2, February 2018.
[6] Timofte, R.; Van Gool, L., "Multi-view manhole detection, recognition, and 3D localisation," Computer Vision Workshops (ICCV Workshops), 2011 IEEE International Conference, vol., no., pp.188.195, 6-13 Nov. 2011.
[7] Yash Narale, Apurva Jogal, Himani Choudhary, S. P Bhosale” Underground Drainage Monitoring System Using IoT”, International Journals And Research Ideas And Innovations In Technology.
[8] Lazarescu, M.T., "Design of a WSN Platform for Long-Term Environmental Monitoring for IoT Applications," Emerging and Selected Topics in Circuits And Systems, IEEE Journal on, vol.3, no.1, pp.45, 54, March 2013.
[9] Prof Muragesh SK1, Santhosha Rao2, “Automated Internet of Things For Underground Drainage and Manhole Monitoring Systems For Metropolitan Cities.” International Journal of Innovative Science, Engineering & Technology, Vol. 2 Issue 4, June 2015.
[10] Prof S. A. Shaikh1, Suvarna A. Sonawane2,” Monitoring Smart City Application Using Raspberry PI based on IoT” International Journal of Innovative Science, Engineering & Technology, Vol 5 Issue VIL, July 2017.
Department of ECE 1 Thejus Engineering College
Comments
Post a Comment